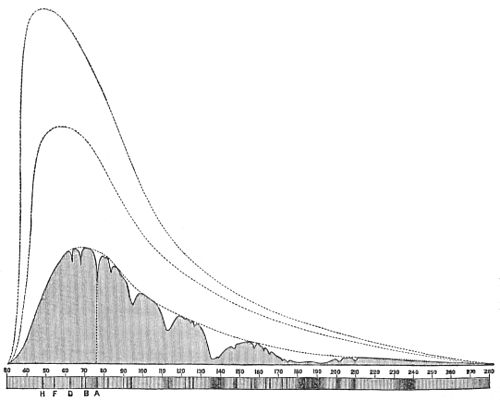
Now, the shaded curve above the spectrum represents the amount of energy in the sun's rays at the foot of the mountain, and was obtained in this way: Fix your attention for a moment on any single part of the spectrum, for instance, that whose wave-length is 60. If the heat in this ray, as represented by the bolometer at the foot of the mountain, was (let us suppose) 2°, on any arbitrary scale we draw a vertical line, two inches, or two feet high over that part of the spectrum. If the heat at another point, such as 40, were but 15°, a line would be drawn there a quarter of an inch high, and so on, till these vertical lines mark out the shaded parts of the drawing, the gaps and depressions in whose outline correspond to the "cold bands" already spoken of. Again, if on top of the mountain we measure all these over once more, we shall find all are hotter, so that we must up there make all our lines higher, but in very different proportions. At 60, for instance, the heat (and light) may have grown from 2° to 3°, or increased one half, while above 40 the heat (and light) may have grown from 15° to 1° or increased five times.

Distribution of Solar Energy at Sea-level and at various Altitudes.
These mountain measurements give another spectrum, the energies in each part of which are defined by the middle dotted line, which we see indicates very much greater energy whether heat or light in the blue end than below. Next, the light or heat which would be observed at the surface of the atmosphere is found in this way. If the mountain-top rises through one half the absorbing mass of this terrestrial atmosphere (it does not quite do so, in fact), and, by getting rid of that lower half, the ray 60 has grown in bright-
