File:EB1911 Ocean and Oceanography - vertical distribution of sea temperature.jpg

From Wikisource
Jump to navigation Jump to search

Original file(724 × 869 pixels, file size: 125 KB, MIME type: image/jpeg)

Summary

Description
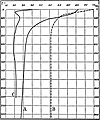
English: Diagram illustrating the vertical distribution of sea temperature. The normal vertical distribution of temperature is illustrated in curve A, which represents a sounding in the South Atlantic; and this arrangement of a rapid fall of temperature giving place gradually to an extremely slow but steady diminution as depth increases is termed anathermic (ἀνά, back, and θερμός, warm). Curve B shows the typical distribution of temperature in an enclosed sea, in this case the Sulu Basin of the Malay Sea, where from the level of the barrier to the bottom the temperature remains uniform or homothermic. Curve C shows a typical summer condition in the polar seas, where layers of sea-water at different temperatures are superimposed, the arrangement from the surface to 200 fathoms is termed dichathermic (δίχα, apart), from 1000 to 2000 fathoms it is termed katathermic (κατά, down). In autumn the enclosed seas of high latitudes frequently present a thermal stratification in which a warm middle layer is sandwiched between a cold upper layer and a cold mass below, the arrangement being termed mesothermic (μέσος, middle).
Date published 1911
Source “Ocean and Oceanography,” Encyclopædia Britannica (11th ed.), v. 19, 1911, p. 984, fig. 1.
Author Otto Krümmel and Hugh Robert Mill wrote the article
Permission
(Reusing this file)
Public domain This image comes from the 13th edition of the Encyclopædia Britannica or earlier. The copyrights for that book have expired in the United States because the book was first published in the US with the publication occurring before January 1, 1929. As such, this image is in the public domain in the United States.

File history

Click on a date/time to view the file as it appeared at that time.

Date/TimeThumbnailDimensionsUserComment
current16:21, 3 May 2018Thumbnail for version as of 16:21, 3 May 2018724 × 869 (125 KB)Bob Burkhardt{{Information |description ={{en|1=Diagram illustrating the vertical distribution of sea temperature. The normal vertical distribution of temperature is illustrated in curve A, which represents a sounding in the South Atlantic; and this arrangement of a rapid fall of temperature giving place gradually to an extremely slow but steady diminution as depth increases is termed anathermic (ἀνά, back, and θερμός, warm). Curve B shows the typical distribution of temperature in an enclosed sea, in t...