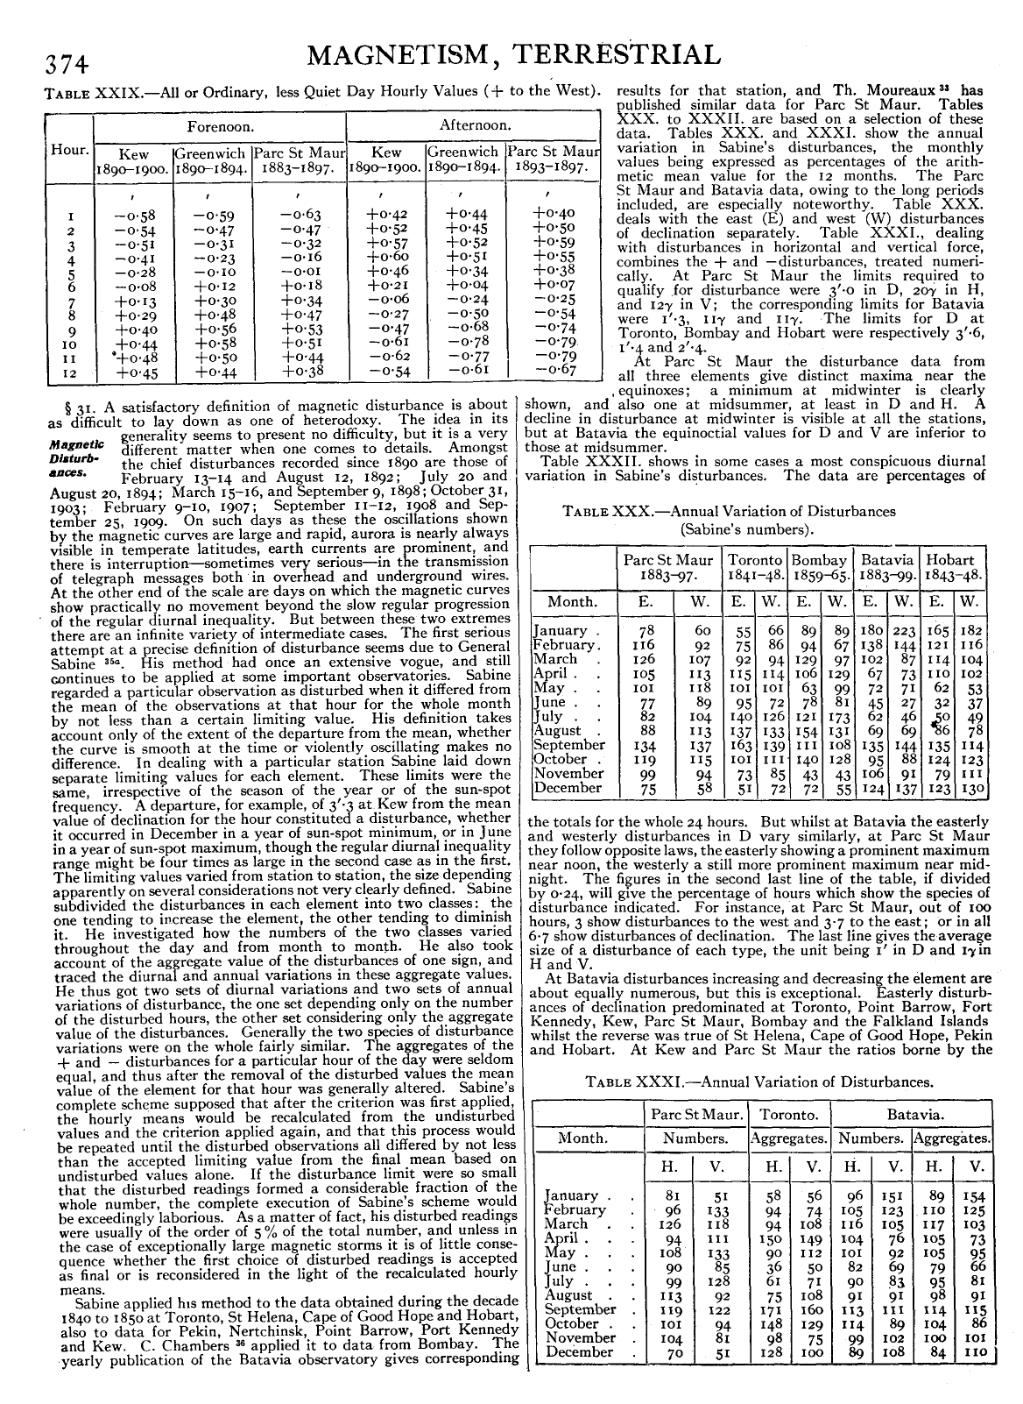
Table XXIX.—All or Ordinary, less Quiet Day Hourly Values (+ to the West).
| Hour. | Forenoon. | Afternoon. | ||||
| Kew 1890–1900. | Greenwich 1890–1894. | Parc St Maur 1883–1897. | Kew 1890–1900. | Greenwich 1890–1894. | Parc St Maur 1893–1897. | |
| ′ | ′ | ′ | ′ | ′ | ′ | |
| 1 | −0.58 | −0.59 | −0.63 | +0.42 | +0.44 | +0.40 |
| 2 | −0.54 | −0.47 | −0.47 | +0.52 | +0.45 | +0.50 |
| 3 | −0.51 | −0.31 | −0.32 | +0.57 | +0.52 | +0.59 |
| 4 | −0.41 | −0.23 | −0.16 | +0.60 | +0.51 | +0.55 |
| 5 | −0.28 | −0.10 | −0.01 | +0.46 | +0.34 | +0.38 |
| 6 | −0.08 | +0.12 | +0.18 | +0.21 | +0.04 | +0.07 |
| 7 | +0.13 | +0.30 | +0.34 | −0.06 | −0.24 | −0.25 |
| 8 | +0.29 | +0.48 | +0.47 | −0.27 | −0.50 | −0.54 |
| 9 | +0.40 | +0.56 | +0.53 | −0.47 | −0.68 | −0.74 |
| 10 | +0.44 | +0.58 | +0.51 | −0.61 | −0.78 | −0.79 |
| 11 | +0.48 | +0.50 | +0.44 | −0.62 | −0.77 | −0.79 |
| 12 | +0.45 | +0.44 | +0.38 | −0.54 | −0.61 | −0.67 |
§ 31. A satisfactory definition of magnetic disturbance is about as difficult to lay down as one of heterodoxy. The idea in its generality seems to present no difficulty, but it is a very different matter when one comes to details. Amongst the chief disturbances recorded since 1890 are those of Magnetic Disturbances. February 13–14 and August 12, 1892; July 20 and August 20, 1894; March 15–16, and September 9, 1898; October 31, 1903; February 9–10, 1907; September 11–12, 1908 and September 25, 1909. On such days as these the oscillations shown by the magnetic curves are large and rapid, aurora is nearly always visible in temperate latitudes, earth currents are prominent, and there is interruption—sometimes very serious—in the transmission of telegraph messages both in overhead and underground wires. At the other end of the scale are days on which the magnetic curves show practically no movement beyond the slow regular progression of the regular diurnal inequality. But between these two extremes there are an infinite variety of intermediate cases. The first serious attempt at a precise definition of disturbance seems due to General Sabine[1]. His method had once an extensive vogue, and still continues to be applied at some important observatories. Sabine regarded a particular observation as disturbed when it differed from the mean of the observations at that hour for the whole month by not less than a certain limiting value. His definition takes account only of the extent of the departure from the mean, whether the curve is smooth at the time or violently oscillating makes no difference. In dealing with a particular station Sabine laid down separate limiting values for each element. These limits were the same, irrespective of the season of the year or of the sun-spot frequency. A departure, for example, of 3′.3 at Kew from the mean value of declination for the hour constituted a disturbance, whether it occurred in December in a year of sun-spot minimum, or in June in a year of sun-spot maximum, though the regular diurnal inequality range might be four times as large in the second case as in the first. The limiting values varied from station to station, the size depending apparently on several considerations not very clearly defined. Sabine subdivided the disturbances in each element into two classes: the one tending to increase the element, the other tending to diminish it. He investigated how the numbers of the two classes varied throughout the day and from month to month. He also took account of the aggregate value of the disturbances of one sign, and traced the diurnal and annual variations in these aggregate values. He thus got two sets of diurnal variations and two sets of annual variations of disturbance, the one set depending only on the number of the disturbed hours, the other set considering only the aggregate value of the disturbances. Generally the two species of disturbance variations were on the whole fairly similar. The aggregates of the + and − disturbances for a particular hour of the day were seldom equal, and thus after the removal of the disturbed values the mean value of the element for that hour was generally altered. Sabine’s complete scheme supposed that after the criterion was first applied, the hourly means would be recalculated from the undisturbed values and the criterion applied again, and that this process would be repeated until the disturbed observations all differed by not less than the accepted limiting value from the final mean based on undisturbed values alone. If the disturbance limit were so small that the disturbed readings formed a considerable fraction of the whole number, the complete execution of Sabine’s scheme would be exceedingly laborious. As a matter of fact, his disturbed readings were usually of the order of 5% of the total number, and unless in the case of exceptionally large magnetic storms it is of little consequence whether the first choice of disturbed readings is accepted as final or is reconsidered in the light of the recalculated hourly means.
Sabine applied his method to the data obtained during the decade 1840 to 1850 at Toronto, St Helena, Cape of Good Hope and Hobart, also to data for Pekin, Nertchinsk, Point Barrow, Port Kennedy and Kew. C. Chambers[2] applied it to data from Bombay. The yearly publication of the Batavia observatory gives corresponding results for that station, and Th. Moureaux [3] has published similar data for Parc St Maur. Tables XXX. to XXXII. are based on a selection of these data. Tables XXX. and XXXI. show the annual variation in Sabine’s disturbances, the monthly values being expressed as percentages of the arithmetic mean value for the 12 months. The Parc St Maur and Batavia data, owing to the long periods included, are especially noteworthy. Table XXX. deals with the east (E) and west (W) disturbances of declination separately. Table XXXI., dealing with disturbances in horizontal and vertical force, combines the + and − disturbances, treated numerically. At Parc St Maur the limits required to qualify for disturbance were 3′.0 in D, 20γ in H, and 12γ in V; the corresponding limits for Batavia were 1′.3, 11γ and 11γ. The limits for D at Toronto, Bombay and Hobart were respectively 3′.6, 1′.4 and 2′.4.
At Parc St Maur the disturbance data from all three elements give distinct maxima near the equinoxes; a minimum at midwinter is clearly shown, and also one at midsummer, at least in D and H. A decline in disturbance at midwinter is visible at all the stations, but at Batavia the equinoctial values for D and V are inferior to those at midsummer.
(Sabine’s numbers).
| Parc St Maur 1883–97. | Toronto 1841–48. | Bombay 1859–65. | Batavia 1883–99. | Hobart 1843–48. | ||||||
| Month. | E. | W. | E. | W. | E. | W. | E. | W. | E. | W. |
| January | 78 | 60 | 55 | 66 | 89 | 89 | 180 | 223 | 165 | 182 |
| February | 116 | 92 | 75 | 86 | 94 | 67 | 138 | 144 | 121 | 116 |
| March | 126 | 107 | 92 | 94 | 129 | 97 | 102 | 87 | 114 | 104 |
| April | 105 | 113 | 115 | 114 | 106 | 129 | 67 | 73 | 110 | 102 |
| May | 101 | 118 | 101 | 101 | 63 | 99 | 72 | 71 | 62 | 53 |
| June | 77 | 89 | 95 | 72 | 78 | 81 | 45 | 27 | 32 | 37 |
| July | 82 | 104 | 140 | 126 | 121 | 173 | 62 | 46 | 50 | 49 |
| August | 88 | 113 | 137 | 133 | 154 | 131 | 69 | 69 | 86 | 78 |
| September | 134 | 137 | 163 | 139 | 111 | 108 | 135 | 144 | 135 | 114 |
| October | 119 | 115 | 101 | 111 | 140 | 128 | 95 | 88 | 124 | 123 |
| November | 99 | 94 | 73 | 85 | 43 | 43 | 106 | 91 | 79 | 111 |
| December | 75 | 58 | 51 | 72 | 72 | 55 | 124 | 137 | 123 | 130 |
Table XXXII. shows in some cases a most conspicuous diurnal variation in Sabine’s disturbances. The data are percentages of the totals for the whole 24 hours. But whilst at Batavia the easterly and westerly disturbances in D vary similarly, at Parc St Maur they follow opposite laws, the easterly showing a prominent maximum near noon, the westerly a still more prominent maximum near midnight. The figures in the second last line of the table, if divided by 0.24, will give the percentage of hours which show the species of disturbance indicated. For instance, at Parc St Maur, out of 100 hours, 3 show disturbances to the west and 3.7 to the east; or in all 6.7 show disturbances of declination. The last line gives the average size of a disturbance of each type, the unit being 1′ in D and 1γ in H and V.
Table XXXI.—Annual Variation of Disturbances.
| Parc St Maur. | Toronto. | Batavia. | ||||||
| Month. | Numbers. | Aggregates. | Numbers. | Aggregates. | ||||
| H. | V. | H. | V. | H. | V. | H. | V. | |
| January | 81 | 51 | 58 | 56 | 96 | 151 | 89 | 154 |
| February | 96 | 133 | 94 | 74 | 105 | 123 | 110 | 125 |
| March | 126 | 118 | 94 | 108 | 116 | 105 | 117 | 103 |
| April | 94 | 111 | 150 | 149 | 104 | 76 | 105 | 73 |
| May | 108 | 133 | 90 | 112 | 101 | 92 | 105 | 95 |
| June | 90 | 85 | 36 | 50 | 82 | 69 | 79 | 66 |
| July | 99 | 128 | 61 | 71 | 90 | 83 | 95 | 81 |
| August | 113 | 92 | 75 | 108 | 91 | 91 | 98 | 91 |
| September | 119 | 122 | 171 | 160 | 113 | 111 | 114 | 115 |
| October | 101 | 94 | 148 | 129 | 114 | 89 | 104 | 86 |
| November | 104 | 81 | 98 | 75 | 99 | 102 | 100 | 101 |
| December | 70 | 51 | 128 | 100 | 89 | 108 | 84 | 110 |
At Batavia disturbances increasing and decreasing the element are about equally numerous, but this is exceptional. Easterly disturbances of declination predominated at Toronto, Point Barrow, Fort Kennedy, Kew, Parc St Maur, Bombay and the Falkland Islands whilst the reverse was true of St Helena, Cape of Good Hope, Pekin and Hobart. At Kew and Parc St Maur the ratios borne by the