eastern to the western disturbances were 1.19 and 1.23 respectively,
and so not much in excess of unity; but the preponderance of easterly
disturbances at the North American[1] stations was considerably
larger than this.
Table XXXII.—Diurnal Variation of Disturbances (Sabine’s numbers).
| Hour. | Parc St Maur. | Batavia. | ||||||||||
| D. | H. | V. | D. | H. | V. | |||||||
| E. | W. | + | − | + | − | E. | W. | + | − | + | − | |
| 0–3 | 10.1 | 20.3 | 9.0 | 8.3 | 5.7 | 9.2 | 1.1 | 5.8 | 13.1 | 6.6 | 4.0 | 7.4 |
| 3–6 | 12.3 | 8.2 | 8.4 | 8.0 | 6.4 | 10.4 | 7.6 | 7.3 | 14.2 | 4.8 | 6.3 | 10.0 |
| 6–9 | 15.7 | 3.8 | 14.1 | 12.5 | 7.2 | 9.0 | 24.9 | 16.8 | 12.1 | 9.9 | 21.2 | 21.7 |
| 9–noon | 16.2 | 5.1 | 18.0 | 15.6 | 12.9 | 15.4 | 38.5 | 33.0 | 8.6 | 15.8 | 19.8 | 16.4 |
| noon–3 | 19.3 | 6.7 | 15.3 | 16.5 | 18.2 | 18.3 | 18.8 | 24.7 | 16.8 | 21.1 | 23.5 | 22.1 |
| 3–6 | 14.8 | 9.7 | 12.5 | 15.4 | 22.9 | 21.8 | 6.4 | 5.4 | 13.3 | 16.9 | 12.6 | 12.7 |
| 6–9 | 5.7 | 21.2 | 11.4 | 13.2 | 18.9 | 11.2 | 2.3 | 3.4 | 9.9 | 13.6 | 7.1 | 4.1 |
| 9–12 | 5.9 | 25.0 | 11.2 | 10.5 | 7.8 | 4.7 | 0.4 | 3.8 | 12.0 | 11.1 | 5.6 | 5.4 |
| Mean number per day | 0.88 | 0.72 | 1.15 | 1.56 | 1.04 | 0.96 | 0.46 | 0.44 | 1.62 | 1.61 | 1.19 | 1.13 |
| Mean size | · · | · · | · · | · · | · · | · · | 1.72 | 1.69 | 18.0 | 19.5 | 16.7 | 15.5 |

§ 32. From the point of view of the surveyor there is a good deal to be said for Sabine’s definition of disturbance, but it is less satisfactory from other standpoints. One objection has been already indicated, viz. the arbitrariness of applying the same limiting value at a station irrespective of the size of the normal diurnal range at the time. Similarly it is arbitrary to apply the same limit between 10 a.m. and noon, when the regular diurnal variation is most rapid, as between 10 p.m. and midnight, when it is hardly appreciable. There seems a distinct difference of phase between the diurnal inequalities on different types of days at the same season; also the phase angles in the Fourier terms vary continuously throughout the year, and much more rapidly at some stations and at some seasons than at others. Thus there may be a variety of phenomena which one would hesitate to regard as disturbances which contribute to the annual and diurnal variations in Tables XXX. to XXXII.
Sabine, as we have seen, confined his attention to the departure of the hourly reading from the mean for that hour. Another and equally natural criterion is the apparent character of the magnetograph curve. At Potsdam curves are regarded as “1” quiet, “2” moderately disturbed, or “3” highly disturbed. Any hourly value to which the numeral 3 is attached is treated as disturbed, and the annual Potsdam publication contains tables giving the annual and diurnal variations in the number of such disturbed hours for D, H and V. According to this point of view, the extent to which the hourly value departs from the mean for that hour is immaterial to the results. It is the greater or less sinuosity and irregularity of the curve that counts. Tables XXXIII. and XXXIV. give an abstract of the mean Potsdam results from 1892 to 1901. The data are percentages: in Table XXXIII. of the mean monthly total, in Table XXXIV. of the total for the day. So far as the annual variation is concerned, the results in Table XXXIII. are fairly similar to those in Table XXX. for Parc St Maur. There are pronounced maxima near the equinoxes, especially the spring equinox. The diurnal variations, however, in Tables XXXII. and XXXIV. are dissimilar. Thus in the case of H the largest disturbance numbers at Parc St Maur occurred between 6 a.m. and 6 p.m., whereas in Table XXXIV. they occur between 4 p.m. and midnight. Considering the comparative proximity of Parc St Maur and Potsdam, one must conclude that the apparent differences between the results for these two stations are due almost entirely to the difference in the definition of disturbance.
Table XXXIII.—Annual Variation of Potsdam Disturbances.
| Element. | Jan. | Feb. | Mar. | April. | May. | June. | July. | Aug. | Sept. | Oct. | Nov. | Dec. |
| D | 129 | 170 | 149 | 90 | 86 | 57 | 62 | 64 | 59 | 118 | 94 | 82 |
| H | 109 | 133 | 131 | 102 | 109 | 82 | 94 | 91 | 89 | 101 | 75 | 84 |
| V | 106 | 171 | 170 | 108 | 121 | 56 | 64 | 74 | 93 | 87 | 78 | 70 |
| Mean | 115 | 158 | 150 | 100 | 105 | 65 | 73 | 76 | 94 | 102 | 82 | 79 |
Table XXXIV.—Diurnal Variation of Potsdam Disturbances.
| Hours. | 13. | 4–6. | 7–9. | 10–noon. | 1–3. | 4–6. | 7–9. | 10–12. |
| D | 14.9 | 11.1 | 8.0 | 5.2 | 5.7 | 13.1 | 22.5 | 19.5 |
| H | 10.5 | 8.4 | 8.0 | 8.5 | 11.3 | 17.6 | 19.2 | 16.5 |
| V | 13.5 | 9.7 | 5.7 | 4.7 | 8.5 | 17.2 | 21.5 | 19.2 |
| Mean | 13.0 | 9.7 | 7.2 | 6.1 | 8.5 | 16.0 | 21.1 | 18.4 |
Table XXXV.—Disturbed Day less ordinary Day Inequality (Unit 1′, + to West).
| Hour. | 1 | 2 | 3 | 4 | 5 | 6 | 7 | 8 | 9 | 10 | 11 | 12 |
| a.m. | −3.4 | −2.6 | −2.0 | −0.3 | +1.6 | +1.9 | +2.3 | +2.0 | +2.1 | +2.0 | +1.6 | +1.8 |
| p.m. | +1.8 | +2.2 | +2.1 | +1.7 | +1.4 | 0.0 | −1.3 | −2.8 | −3.5 | −2.6 | −3.5 | −2.4 |
One difficulty in the Potsdam procedure is the maintenance of a uniform standard. Unless very frequent reference is made to the curves of some standard year there must be a tendency to enter under “3” in quiet years a number of hours which would be entered under “2” in a highly disturbed year. Still, such a source of uncertainty is unlikely to have much influence on the diurnal, or even on the annual, variation.
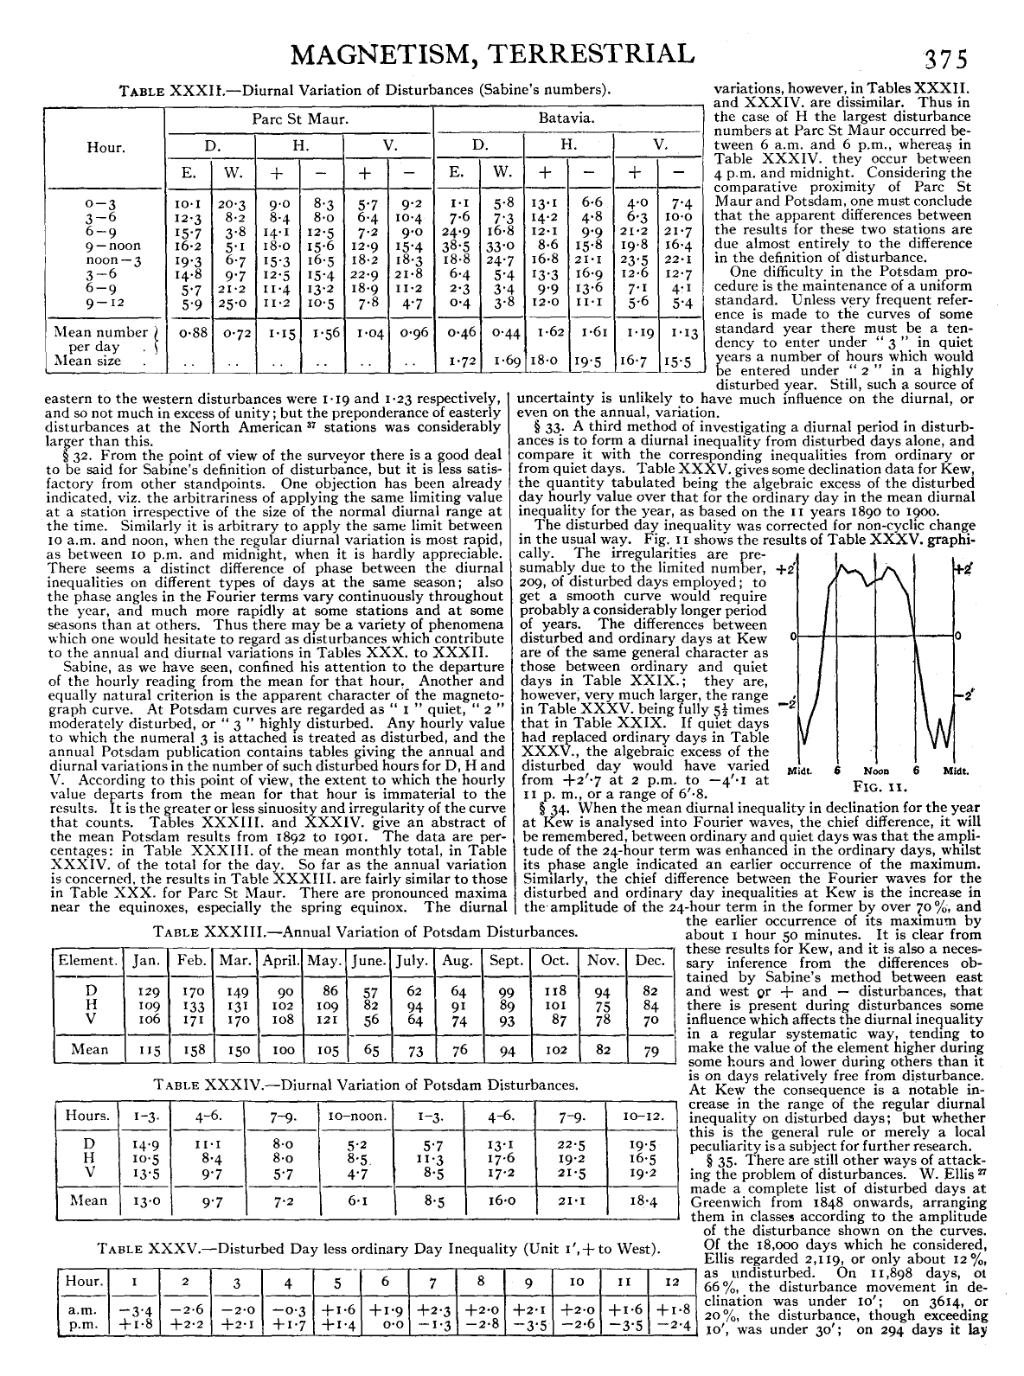
§ 33. A third method of investigating a diurnal period in disturbances is to form a diurnal inequality from disturbed days alone, and compare it with the corresponding inequalities from ordinary or from quiet days. Table XXXV. gives some declination data for Kew, the quantity tabulated being the algebraic excess of the disturbed day hourly value over that for the ordinary day in the mean diurnal inequality for the year, as based on the 11 years 1890 to 1900.
 |
| Fig. 11. |
The disturbed day inequality was corrected for non-cyclic change in the usual way. Fig. 11 shows the results of Table XXXV. graphically. The irregularities are presumably due to the limited number, 209, of disturbed days employed; to get a smooth curve would require probably a considerably longer period of years. The differences between disturbed and ordinary days at Kew are of the same general character as those between ordinary and quiet days in Table XXIX.; they are, however, very much larger, the range in Table XXXV. being fully 512 times that in Table XXIX. If quiet days had replaced ordinary days in Table XXXV., the algebraic excess of the disturbed day would have varied from +2′.7 at 2 p.m. to −4′.1 at 11 p.m., or a range of 6′.8.
§ 34. When the mean diurnal inequality in declination for the year at Kew is analysed into Fourier waves, the chief difference, it will be remembered, between ordinary and quiet days was that the amplitude of the 24-hour term was enhanced in the ordinary days, whilst its phase angle indicated an earlier occurrence of the maximum. Similarly, the chief difference between the Fourier waves for the disturbed and ordinary day inequalities at Kew is the increase in the amplitude of the 24-hour term in the former by over 70%, and the earlier occurrence of its maximum by about 1 hour 50 minutes. It is clear from these results for Kew, and it is also a necessary inference from the differences obtained by Sabine’s method between east and west or + and − disturbances, that there is present during disturbances some influence which affects the diurnal inequality in a regular systematic way, tending to make the value of the element higher during some hours and lower during others than it is on days relatively free from disturbance. At Kew the consequence is a notable increase in the range of the regular diurnal inequality on disturbed days; but whether this is the general rule or merely a local peculiarity is a subject for further research.
§ 35. There are still other ways of attacking the problem of disturbances. W. Ellis[2] made a complete list of disturbed days at Greenwich from 1848 onwards, arranging them in classes according to the amplitude of the disturbance shown on the curves. Of the 18,000 days which he considered, Ellis regarded 2,119, or only about 12%, as undisturbed. On 11,898 days, or 66%, the disturbance movement in declination was under 10′; on 3614, or 20%, the disturbance, though exceeding 10′, was under 30′; on 294 days it lay