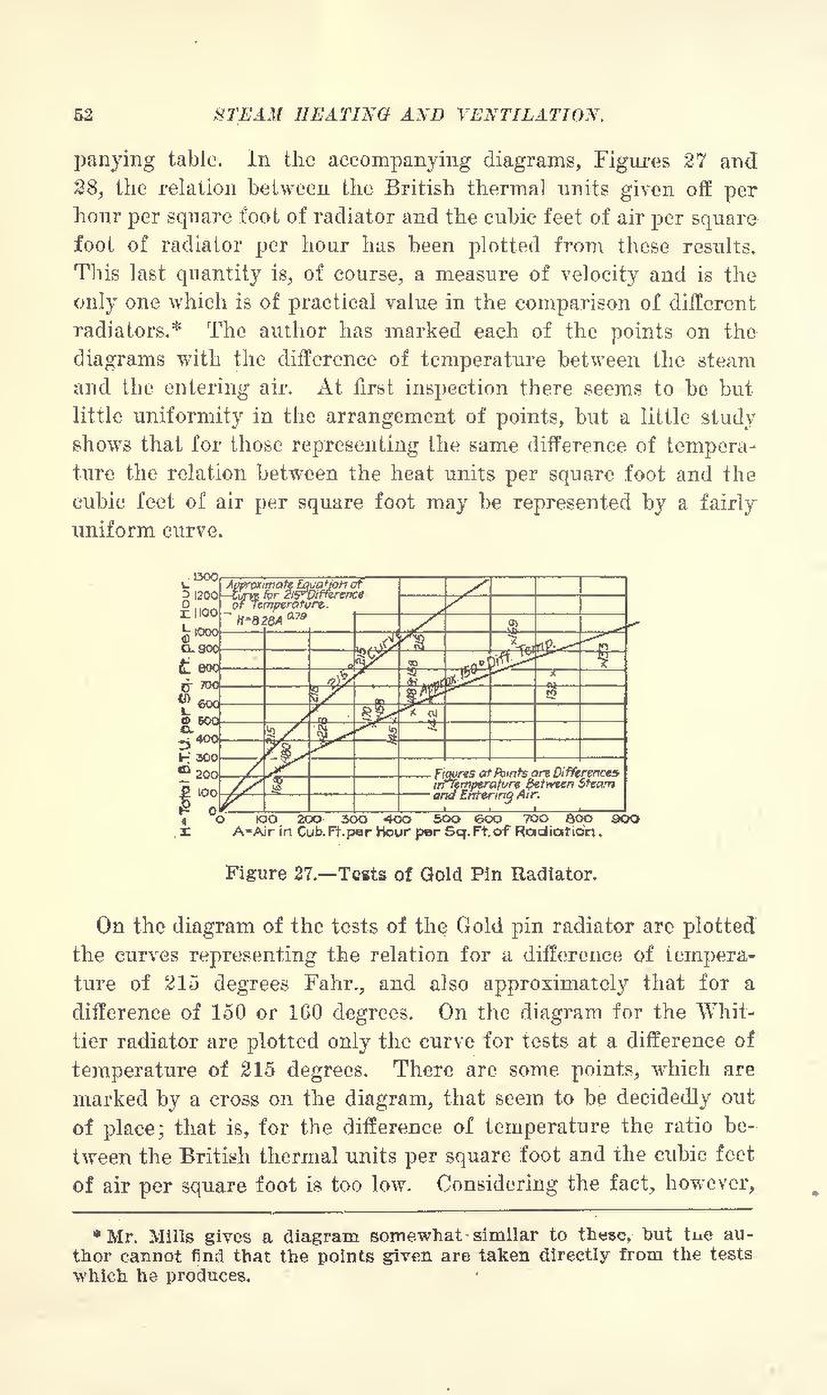
panying table. In the accompanying diagrams, Figures 27 and 28, the relation between the British thermal units given off per hour per square foot of radiator and the cubic feet of air per square foot of radiator per hour has been plotted from these results. This last quantity is, of course, a measure of velocity and is the only one which is of practical value in the comparison of different radiators.[1] The author has marked each of the points on the diagrams with the difference of temperature between the steam and the entering air. At first inspection there seems to be but little uniformity in the arrangement of points, but a little study shows that for those representing the same difference of temperature the relation between the heat units per square foot and the cubic feet of air per square foot may be represented by a fairly uniform curve.

Figure 27.—Tests of Gold Pin Radiator.
On the diagram of the tests of the Gold pin radiator are plotted the curves representing the relation for a difference of temperature of 215 degrees Fahr., and also approximately that for a difference of 150 or 160 degrees. On the diagram for the Whittier radiator are plotted only the curve for tests at a difference of temperature of 215 degrees. There are some points, which are marked by a cross on the diagram, that seem to be decidedly out of place; that is, for the difference of temperature the ratio between the British thermal units per square foot and the cubic feet of air per square foot is too low. Considering the fact, however,
- ↑ Mr. Mills gives a diagram somewhat similar to these, but the author cannot find that the points given are taken directly from the tests which he produces.