File:EB9 United States - temperature chart.jpg
Jump to navigation
Jump to search
Size of this preview: 800 × 565 pixels. Other resolutions: 320 × 226 pixels | 640 × 452 pixels | 1,024 × 723 pixels | 1,280 × 904 pixels | 2,414 × 1,705 pixels.
Original file (2,414 × 1,705 pixels, file size: 2.01 MB, MIME type: image/jpeg)
| This is a file from the Wikimedia Commons. Information from its description page there is shown below. Commons is a freely licensed media file repository. You can help. |
Summary
| Description |
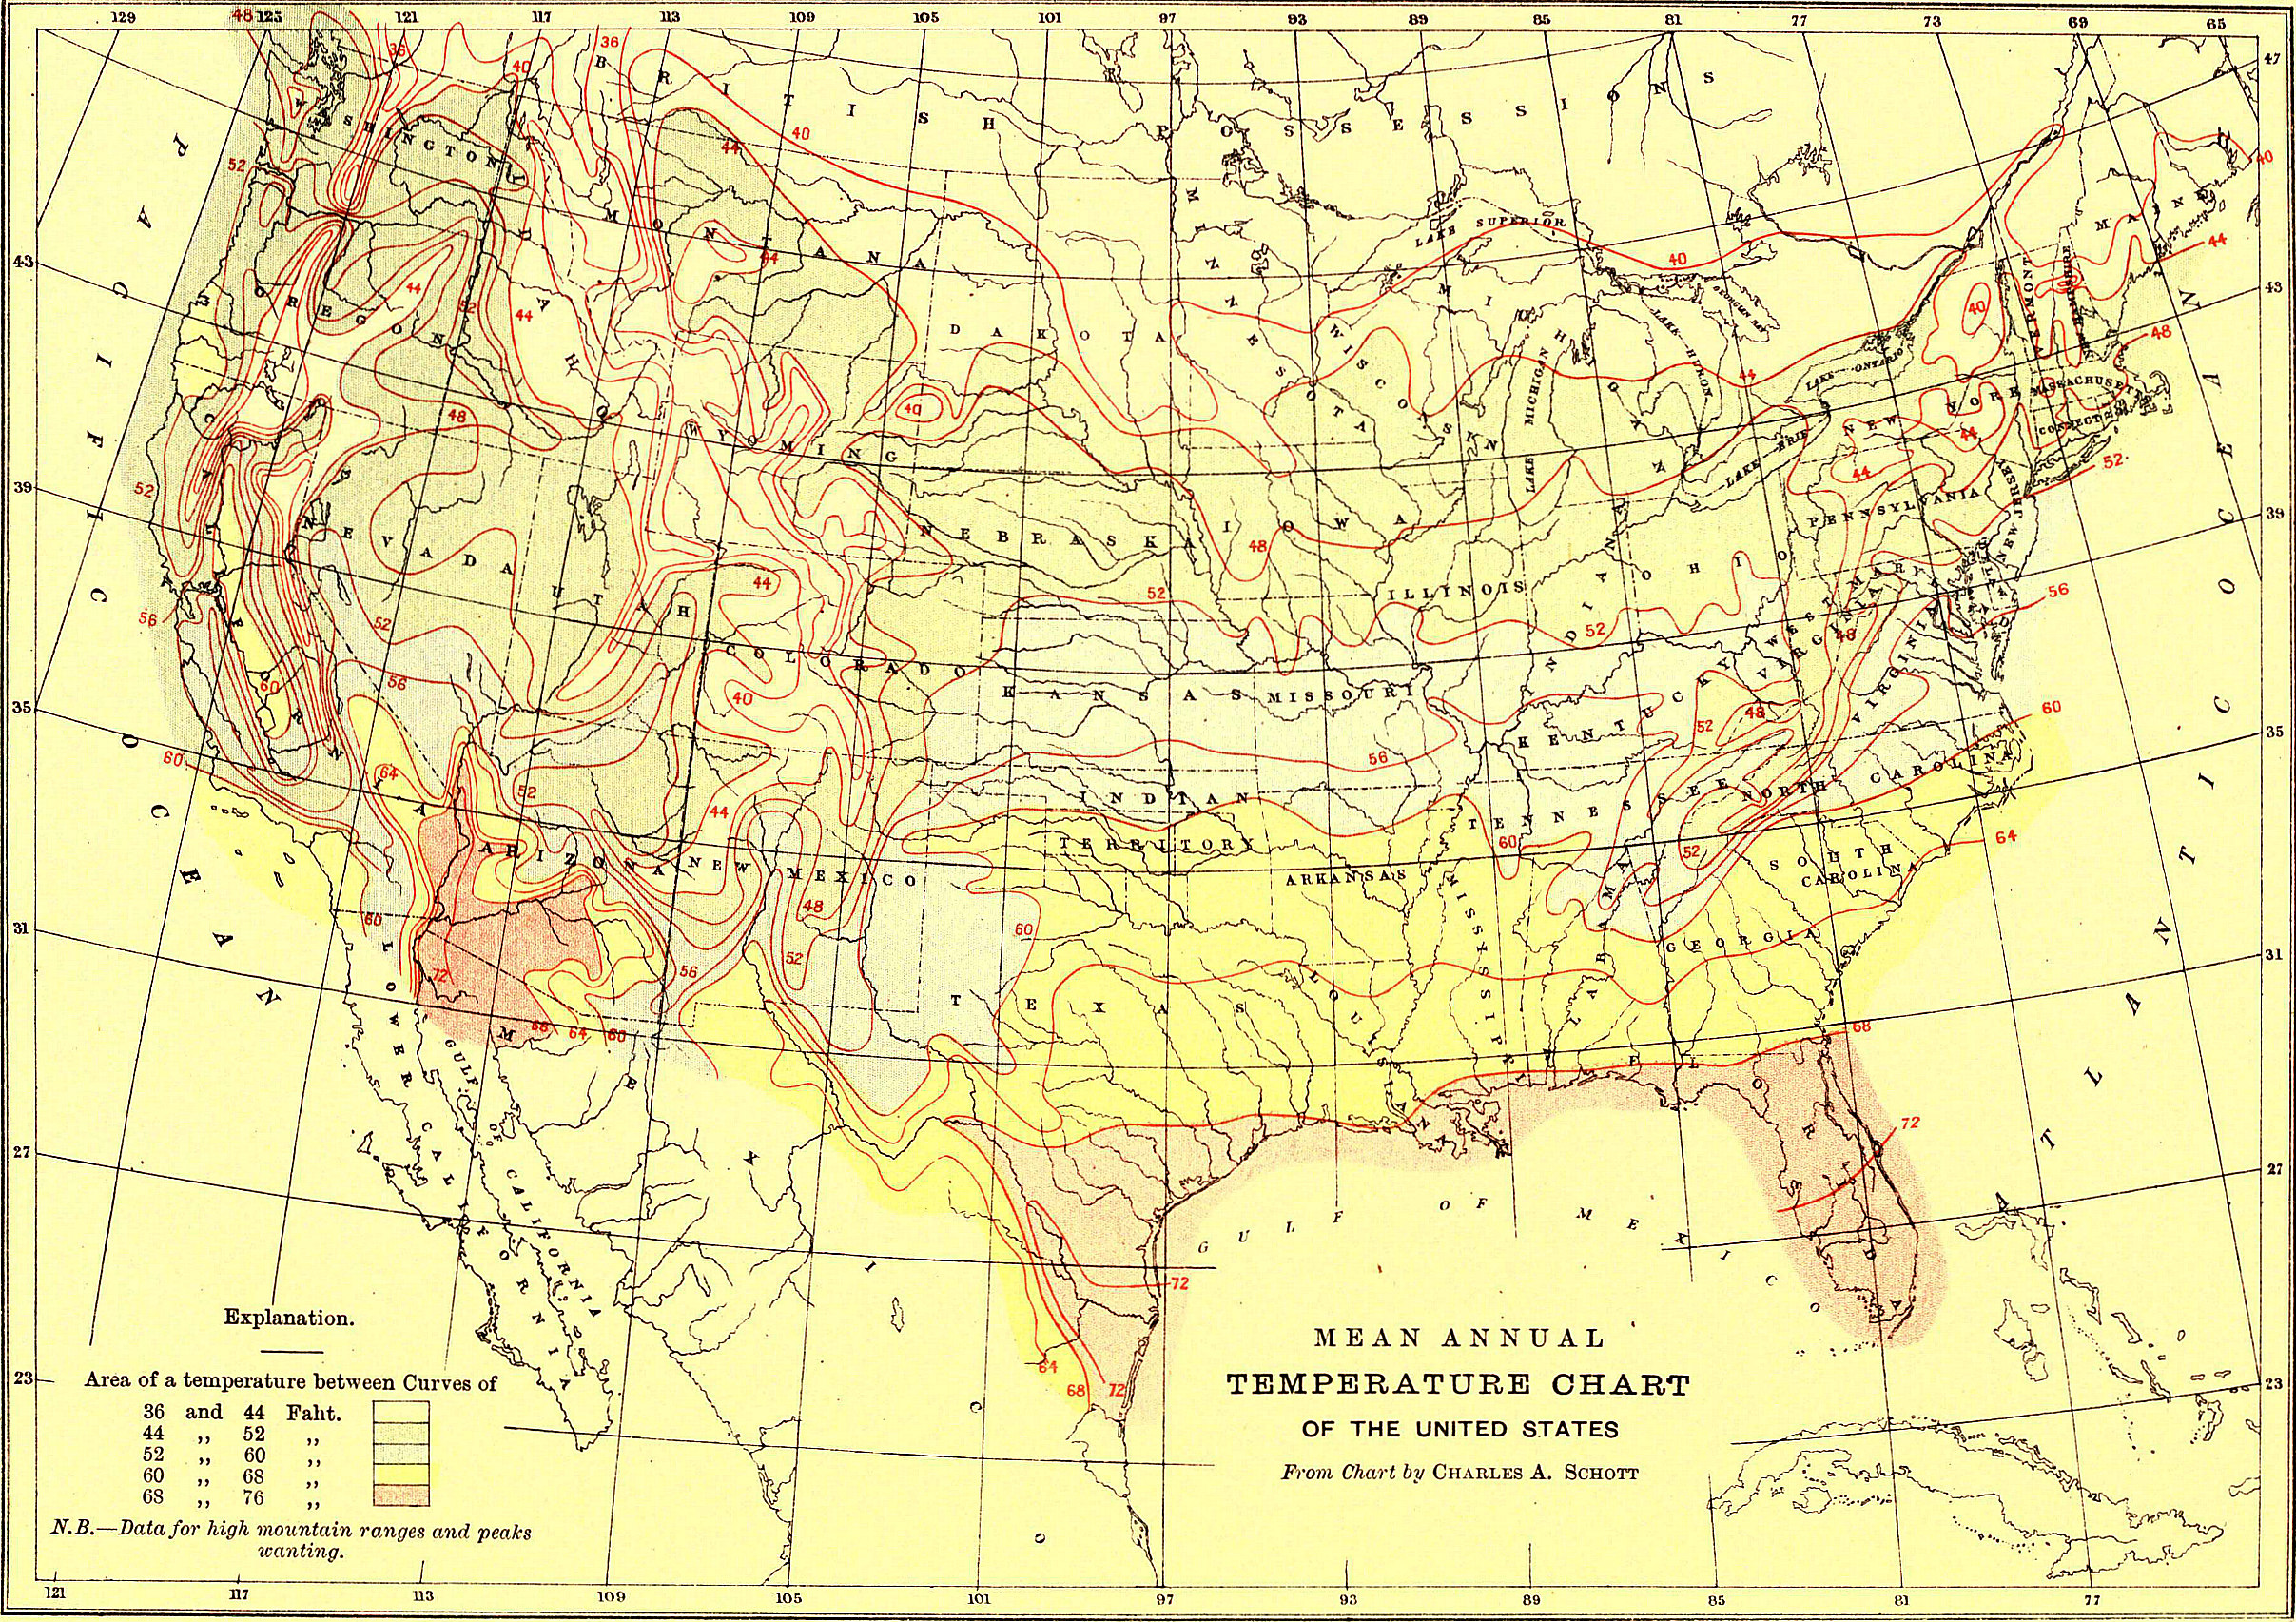
English: Title: Mean Annual Temperature Chart of the United States From Chart by Charles A. Schott. Explanation: Area of a temperature between Curves of 36 and 44 Fahr. [white], 44 and 52 Fahr. [green], 52 and 60 Fahr. [blue], 60 and 68 Fahr. [yellow], 68 and 76 Fahr. [red]. Nota Bene—Data for high mountain ranges and parks wanting. |
|||
| Date | ||||
| Source | “United States” in the Encyclopædia Britannica, 9th ed., Vol. XXIII, Plate IX. (left), between pp. 804 and 805. | |||
| Author | From an original map by Charles Anthony Schott, engraved by William & Alexander Keith Johnston. | |||
| Permission (Reusing this file) |
|

File history
Click on a date/time to view the file as it appeared at that time.
| Date/Time | Thumbnail | Dimensions | User | Comment | |
|---|---|---|---|---|---|
| current | 21:15, 15 August 2018 | | 2,414 × 1,705 (2.01 MB) | Bob Burkhardt | {{Information |description ={{en|1=A temperature chart (annual mean) for the United States.}} |date =published 1888 |source =“United States,” ''Encyclopædia Britannica'' (9th ed.), v. 23, 1888, between pp. 804 and 805 (first plate). |author =W. & A. K. Johnston |permission ={{PD-Britannica}} }} Category:Old weather and climate maps Category:Old maps of the United States |
File usage
The following 2 pages use this file: