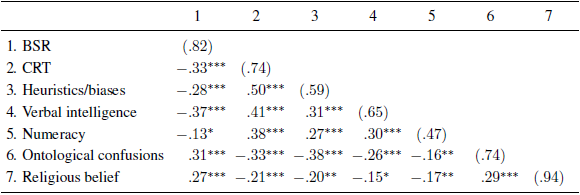
Table 1: Pearson product-moment correlations (Study 1; N = 279). BSR = Bullshit Receptivity scale; CRT = Cognitive Reflection Test. Cronbach’s alphas are reported in brackets. ∗∗∗ p < .001, ** p < .01, ∗ p < .05.

Author Affiliation
Department of Psychology
University of Waterloo
Waterloo, Ontario, Canada
gpennyco@uwaterloo.ca
eral Social Survey (starting in 1974). The Wordsum measure had acceptable reliability (α = .65). We also assessed
numeracy using a 3-item measure (Schwartz, Woloshin,
Black & Welch, 1997). The frequently used 3-item numeracy scale is strongly related to an expanded and more
difficult 7-item numeracy scale, suggesting that both scales
loaded on a single construct (labelled “global numeracy”
by Lipkus, Samsa, and Rimer, 2001). However, we employed the shorter 3-item version for expediency, but it did
not achieve acceptable reliability (α = .47).
We used a 14-item ontological confusions scale (Lindeman & Aarnio, 2007; Lindeman, et al., 2008; Svedholm
& Lindeman, 2013), translated into English from Finnish.
Participants were given the following instructions: “Do you
think the following statements can be literally true, the way
a sentence such as ‘Wayne Gretzky was a hockey player’
is true? Or are they true only in a metaphorical sense, like
the expression ‘Friends are the salt of life’?”. They were
then presented items such as “A rock lives for a long time”
and asked to rate how metaphorical/literal the statement is
on the following scale: 1= fully metaphorical, 2 = more
metaphorical than literal, 3 = in between, 4 = more literal
than metaphorical, 5 = fully literal. Those who rate the
statements as more literal are considered more ontologically
confused. Participants were also given 3 metaphors (e.g.,
“An anxious person is a prisoner to their anxiety”) and 3 literal statements (e.g., “Flowing water is a liquid”) as filler
items that did not factor into the mean ontological confusion score. The ontological confusions scale had acceptable
internal consistency (α = .74).
Finally, participants completed an 8-item religious belief
questionnaire (Pennycook et al., 2014). Participants were
asked to rate their level of agreement/disagreement (1 –
strongly disagree to 5 – strongly agree) with 8 commonly
held religious beliefs (afterlife, heaven, hell, miracles, angels, demons, soul, Satan). The scale had excellent internal
consistency (α = .94).
6.3Procedure
Following a short demographic questionnaire, participants
completed the tasks in the following order: heuristics and
biases battery, Wordsum, numeracy, CRT2, CRT1, ontological confusion scale, bullshit receptivity, and religious belief
questionnaire.
7Results
The Bullshit Receptivity (BSR) scale had good internal consistency (α = .82). A summary of descriptive statistics for
each item and the full BSR scale is reported in Table S1.
The mean profoundness rating was 2.6, which is in-between
“somewhat profound” and “fairly profound” on the 5-point
scale. Indeed, the mean profoundness rating for each item
was significantly greater than 2 (“somewhat profound”), all
t’s > 5.7, all p’s < .001, indicating that our items successfully
elicited a sense of profoundness on the aggregate. Moreover,
only 18.3% (N = 51) of the sample had a mean rating less
than 2. A slight majority of the sample’s mean ratings fell
on or in-between 2 and 3 (54.5%, N = 152) and over a quarter of the sample (27.2%, N = 76) gave mean ratings higher
than 3 (“fairly profound”). These results indicate that our
participants largely failed to detect that the statements are
bullshit.
Next we investigate the possible association between reflective thinking and bullshit receptivity. Pearson productmoment correlations can be found in Table 1. BSR was
strongly negatively correlated with each cognitive measure
except for numeracy (which was nonetheless significant).
Furthermore, both ontological confusions and religious belief were positively correlated with bullshit receptivity.
8Study 2
In Study 1, at least some participants appeared to find meaning in a series of statements that contained a random collec-
